nixtla_statsforecast
To get started:
Dynamically pull and run
from hamilton import dataflows, driver
# downloads into ~/.hamilton/dataflows and loads the module -- WARNING: ensure you know what code you're importing!
nixtla_statsforecast = dataflows.import_module("nixtla_statsforecast", "zilto")
dr = (
    driver.Builder()
    .with_config({})  # replace with configuration as appropriate
    .with_modules(nixtla_statsforecast)
    .build()
)
# If you have sf-hamilton[visualization] installed, you can see the dataflow graph
# In a notebook this will show an image, else pass in arguments to save to a file
# dr.display_all_functions()
# Execute the dataflow, specifying what you want back. Will return a dictionary.
result = dr.execute(
    [nixtla_statsforecast.CHANGE_ME, ...],  # this specifies what you want back
    inputs={...}  # pass in inputs as appropriate
)
Use published library version
pip install sf-hamilton-contrib --upgrade # make sure you have the latest
from hamilton import dataflows, driver
# Make sure you've done - `pip install sf-hamilton-contrib --upgrade`
from hamilton.contrib.user.zilto import nixtla_statsforecast
dr = (
    driver.Builder()
    .with_config({})  # replace with configuration as appropriate
    .with_modules(nixtla_statsforecast)
    .build()
)
# If you have sf-hamilton[visualization] installed, you can see the dataflow graph
# In a notebook this will show an image, else pass in arguments to save to a file
# dr.display_all_functions()
# Execute the dataflow, specifying what you want back. Will return a dictionary.
result = dr.execute(
    [nixtla_statsforecast.CHANGE_ME, ...],  # this specifies what you want back
    inputs={...}  # pass in inputs as appropriate
)
Modify for your needs
Now if you want to modify the dataflow, you can copy it to a new folder (renaming is possible), and modify it there.
dataflows.copy(nixtla_statsforecast, "path/to/save/to")
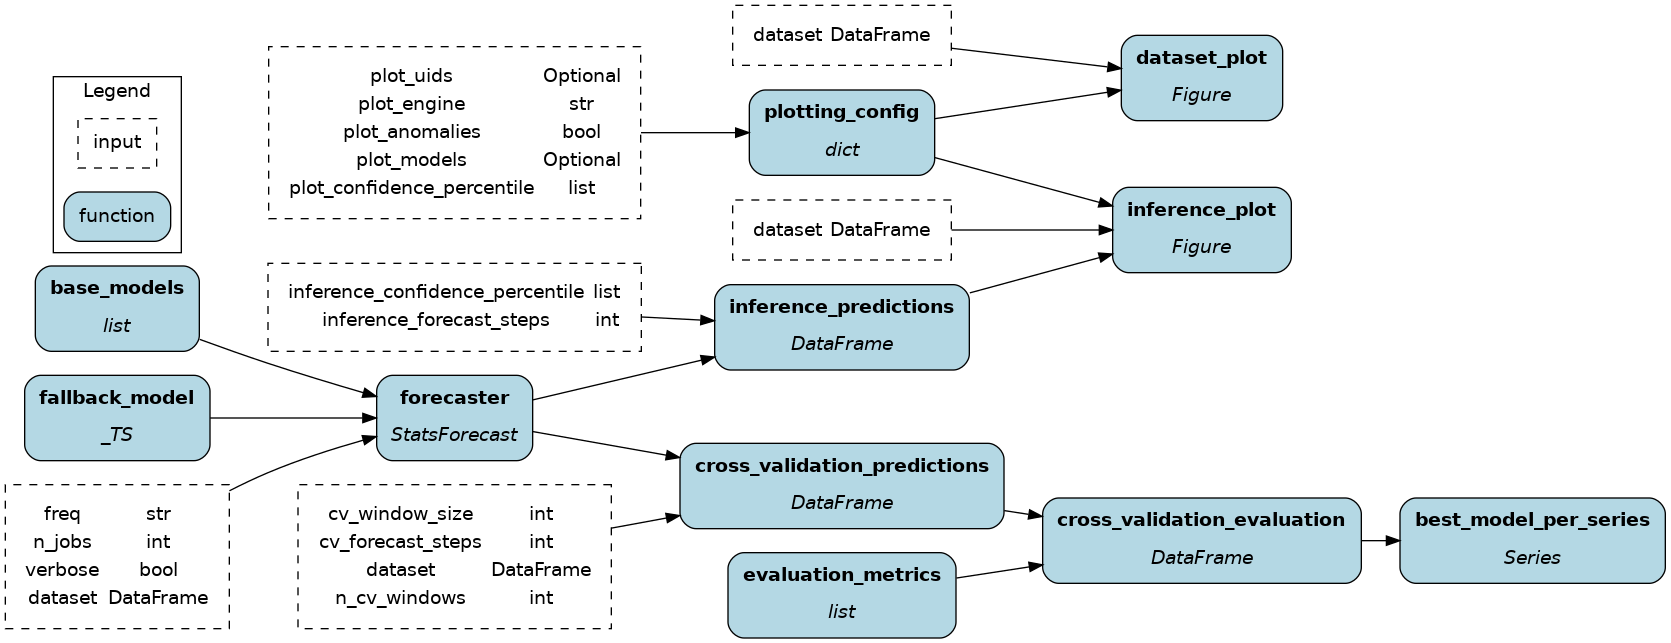
Purpose of this module
This module implements forecasting using statistical methods with statsforecast by Nixtla.
Fit and evaluate a list of models on a time series dataset. Obtain a cross-validation benchmark dataframe and prediction plots.
Your dataset needs to have columns unique_id to identify each series, ds to identify the time step, and y to specify the value of series unique_id at time ds.
Configuration Options
Config.when
This module doesn't receive configurations.
Inputs
freq: Adjust to meet the sampling rate of your time seriescv_forecast_steps,cv_window_size,n_cv_windows: Change these values to define your cross-validation strategy.- ⚠
n_jobs: Set the number of cores to use for compute. The default value-1will use all available cores and might slowdown the machine in the meantime.
Overrides
base_models: Set the list of Nixtla models to fit and evaluate (docs)evaluation_metrics: Set the list of Nixtla-compatible metrics to use during cross-validation (examples)
Limitations
- This flow doesn't include dataset preprocessing steps.
Source code
__init__.py
import logging
from typing import Callable, Optional

logger = logging.getLogger(__name__)

from hamilton import contrib

with contrib.catch_import_errors(__name__, __file__, logger):
    import matplotlib
    import pandas as pd
    from statsforecast import StatsForecast
    from statsforecast.models import (
        _TS,
        AutoARIMA,
        CrostonClassic,
        DynamicOptimizedTheta,
        HistoricAverage,
        HoltWinters,
        SeasonalNaive,
    )
    from utilsforecast.evaluation import evaluate
    from utilsforecast.losses import mse


def base_models() -> list[_TS]:
    """Nixtla stats models to fit and evaluate
    Override with your own models at the Hamilton Driver level.
    """
    season_length = 24
    return [
        AutoARIMA(season_length=season_length),
        HoltWinters(),
        CrostonClassic(),
        SeasonalNaive(season_length=season_length),
        HistoricAverage(),
        DynamicOptimizedTheta(season_length=season_length),
    ]


def fallback_model() -> _TS:
    """Model to be used if a model fails"""
    return SeasonalNaive(season_length=7)


def forecaster(
    dataset: pd.DataFrame,
    base_models: list[_TS],
    fallback_model: _TS,
    freq: str = "M",
    n_jobs: int = -1,
    verbose: bool = False,
) -> StatsForecast:
    """Create the forecasting harness with data and models

    :param freq: frequency of the data, see pandas ref: https://pandas.pydata.org/pandas-docs/stable/user_guide/timeseries.html#offset-aliases
    :param n_jobs: number of cores to use; -1 will use all available cores
    """
    return StatsForecast(
        df=dataset,
        models=base_models,
        fallback_model=fallback_model,
        freq=freq,
        n_jobs=n_jobs,
        verbose=verbose,
    )


def cross_validation_predictions(
    dataset: pd.DataFrame,
    forecaster: StatsForecast,
    cv_forecast_steps: int = 24,
    cv_window_size: int = 24,
    n_cv_windows: int = 2,
) -> pd.DataFrame:
    """Fit models and predict over `n_cv_windows` time windows"""
    return forecaster.cross_validation(
        df=dataset,
        h=cv_forecast_steps,
        step_size=cv_window_size,
        n_windows=n_cv_windows,
    )


def evaluation_metrics() -> list[Callable]:
    """List of metrics to use with `utilsforecast.evaluation.evaluate` in `cross_validation_evaluation`
    The metric function should receive as arguments at least:
        df: pd.DataFrame
        models: list[str]
        id_col: str = "unique_id"
        target_col: str = "y"

    See examples: https://github.com/Nixtla/utilsforecast/blob/main/utilsforecast/losses.py
    """
    return [mse]


def cross_validation_evaluation(
    cross_validation_predictions: pd.DataFrame,
    evaluation_metrics: list[Callable],
) -> pd.DataFrame:
    """Evaluate the crossvalidation predictions and aggregate the performances by series"""
    df = cross_validation_predictions.reset_index()

    models = [m for m in df.columns if m not in ["unique_id", "ds", "cutoff", "y"]]

    evals = []
    for cutoff in df.cutoff.unique():
        eval_ = evaluate(
            df=df.loc[df.cutoff == cutoff],
            metrics=evaluation_metrics,
            models=models,
        )
        evals.append(eval_)

    evaluation_df = pd.concat(evals)
    evaluation_df = evaluation_df.groupby("unique_id").mean(numeric_only=True)
    return evaluation_df


def best_model_per_series(cross_validation_evaluation: pd.DataFrame) -> pd.Series:
    """Return the best model for each series"""
    return cross_validation_evaluation.idxmin(axis=1)


def inference_predictions(
    forecaster: StatsForecast,
    inference_forecast_steps: int = 12,
    inference_confidence_percentile: list[float] = [90.0],  # noqa: B006
) -> pd.DataFrame:
    """Infer values using the training harness. Fitted models aren't stored

    :param inference_forecast_steps: number of steps in the future to forecast
    """
    return forecaster.forecast(
        h=inference_forecast_steps,
        level=inference_confidence_percentile,
    )


def plotting_config(
    plot_uids: Optional[list[str]] = None,
    plot_models: Optional[list[str]] = None,
    plot_anomalies: bool = False,
    plot_confidence_percentile: list[float] = [90.0],  # noqa: B006
    plot_engine: str = "matplotlib",
) -> dict:
    """Configuration for plotting functions"""
    return dict(
        unique_ids=plot_uids,
        models=plot_models,
        plot_anomalies=plot_anomalies,
        level=plot_confidence_percentile,
        engine=plot_engine,
    )


def dataset_plot(dataset: pd.DataFrame, plotting_config: dict) -> matplotlib.figure.Figure:
    """Plot series from the dataset"""
    return StatsForecast.plot(dataset, **plotting_config)


def inference_plot(
    dataset: pd.DataFrame,
    inference_predictions: pd.DataFrame,
    plotting_config: dict,
) -> matplotlib.figure.Figure:
    """Plot forecast values"""
    return StatsForecast.plot(dataset, inference_predictions, **plotting_config)


if __name__ == "__main__":
    # run as a script to test Hamilton's execution
    import __init__ as nixtla_statsforecast

    from hamilton import driver

    dr = driver.Driver(
        {},
        nixtla_statsforecast,
    )
    # create the DAG image
    dr.display_all_functions("dag", {"format": "png", "view": False})
Requirements
matplotlib
numpy
pandas
statsforecast
utilsforecast