air_quality_analysis
To get started:
Dynamically pull and run
from hamilton import dataflows, driver
# downloads into ~/.hamilton/dataflows and loads the module -- WARNING: ensure you know what code you're importing!
air_quality_analysis = dataflows.import_module("air_quality_analysis", "skrawcz")
dr = (
driver.Builder()
.with_config({}) # replace with configuration as appropriate
.with_modules(air_quality_analysis)
.build()
)
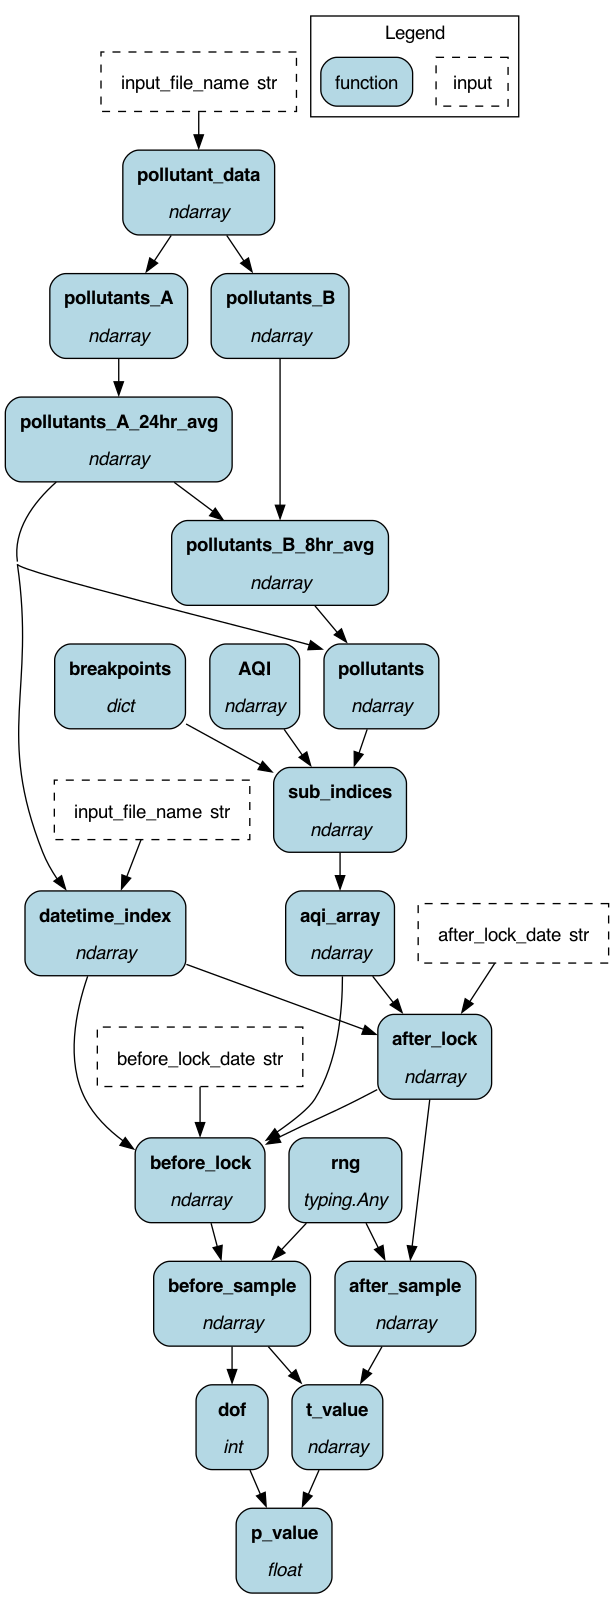
# If you have sf-hamilton[visualization] installed, you can see the dataflow graph
# In a notebook this will show an image, else pass in arguments to save to a file
# dr.display_all_functions()
# Execute the dataflow, specifying what you want back. Will return a dictionary.
result = dr.execute(
[air_quality_analysis.CHANGE_ME, ...], # this specifies what you want back
inputs={...} # pass in inputs as appropriate
)
Use published library version
pip install sf-hamilton-contrib --upgrade # make sure you have the latest
from hamilton import dataflows, driver
# Make sure you've done - `pip install sf-hamilton-contrib --upgrade`
from hamilton.contrib.user.skrawcz import air_quality_analysis
dr = (
    driver.Builder()
    .with_config({})  # replace with configuration as appropriate
    .with_modules(air_quality_analysis)
    .build()
)
# If you have sf-hamilton[visualization] installed, you can see the dataflow graph
# In a notebook this will show an image, else pass in arguments to save to a file
# dr.display_all_functions()
# Execute the dataflow, specifying what you want back. Will return a dictionary.
result = dr.execute(
    [air_quality_analysis.CHANGE_ME, ...],  # this specifies what you want back
    inputs={...}  # pass in inputs as appropriate
)
Modify for your needs
Now if you want to modify the dataflow, you can copy it to a new folder (renaming is possible), and modify it there.
dataflows.copy(air_quality_analysis, "path/to/save/to")
Purpose of this module
This code is based on the example presented in https://github.com/numpy/numpy-tutorials/blob/main/content/tutorial-air-quality-analysis.md
What we've done here is made a dataflow of the computation required to do an AQI analysis. It's very easy to change these functions for more sophisticated analysis, as well as to change the inputs, etc.
Note: this code here is really to show you how to use pure numpy, not the best practices way of doing analysis. In real-life practice you would probably do the following:
- The pandas library is preferable to use for time-series data analysis.
- The SciPy stats module provides the stats.ttest_rel function which can be used to get the t statistic and p value.
- In real life, data is generally not normally distributed. There are tests for such non-normal data like the Wilcoxon test.
You can download some data to use here, or download the following way:
wget https://raw.githubusercontent.com/dagworks-inc/hamilton/main/examples/numpy/air-quality-analysis/air-quality-data.csv
Configuration Options
There is no configuration required for this dataflow. So pass in an empty dictionary.
Limitations
None to really note.
Source code
__init__.py
import logging
import typing
from functools import partial

logger = logging.getLogger(__name__)

from hamilton import contrib

with contrib.catch_import_errors(__name__, __file__, logger):
    import numpy as np
    from numpy.random import default_rng
    from scipy import stats

"""
This code is based on the example presented in
https://github.com/numpy/numpy-tutorials/blob/main/content/tutorial-air-quality-analysis.md

What we've done here is made a dataflow of the computation required to do an AQI analysis.
It's very easy to change these functions for more sophisticated analysis, as well as to
change the inputs, etc.

Note: this code here is really to show you how to use pure numpy, not the best practices way of doing analysis.
In real-life practice you would probably do the following:
* The pandas library is preferable to use for time-series data analysis.
* The SciPy stats module provides the stats.ttest_rel function which can be used to get the t statistic and p value.
* In real life, data is generally not normally distributed. There are tests for such non-normal data like the
  Wilcoxon test.
"""


# --- private helper functions
def _moving_mean(a, n):
    """Computes the moving mean using numpy constructs."""
    ret = np.cumsum(a, dtype=float, axis=0)
    ret[n:] = ret[n:] - ret[:-n]
    return ret[n - 1 :] / n


def _compute_indices(breakpoints: dict, aqi: np.ndarray, pol: str, con: float) -> float:
    """Computes break points for pollutants

    The compute_indices function first fetches the correct upper and lower bounds of AQI categories and breakpoint
    concentrations for the input concentration and pollutant with the help of arrays AQI and breakpoints.

    It is code copied straight from
    https://github.com/numpy/numpy-tutorials/blob/main/content/tutorial-air-quality-analysis.md


    :param breakpoints: dictionary of pollutant to break points.
    :param aqi: array of AQI break points.
    :param pol: pollutant
    :param con: concentration
    :return: index computed
    """
    bp = breakpoints[pol]

    if pol == "CO":
        inc = 0.1
    else:
        inc = 1

    if bp[0] <= con < bp[1]:
        Bl = bp[0]
        Bh = bp[1] - inc
        Ih = aqi[1] - inc
        Il = aqi[0]
    elif bp[1] <= con < bp[2]:
        Bl = bp[1]
        Bh = bp[2] - inc
        Ih = aqi[2] - inc
        Il = aqi[1]
    elif bp[2] <= con < bp[3]:
        Bl = bp[2]
        Bh = bp[3] - inc
        Ih = aqi[3] - inc
        Il = aqi[2]
    elif bp[3] <= con < bp[4]:
        Bl = bp[3]
        Bh = bp[4] - inc
        Ih = aqi[4] - inc
        Il = aqi[3]
    elif bp[4] <= con < bp[5]:
        Bl = bp[4]
        Bh = bp[5] - inc
        Ih = aqi[5] - inc
        Il = aqi[4]
    elif bp[5] <= con:
        Bl = bp[5]
        Bh = bp[5] + bp[4] - (2 * inc)
        Ih = aqi[6]
        Il = aqi[5]
    else:
        print(f"Concentration {con} out of range!")
        raise ValueError(f"Concentration {con} out of range!")

    return ((Ih - Il) / (Bh - Bl)) * (con - Bl) + Il


# -- Hamilton functions


def pollutant_data(input_file_name: str) -> np.ndarray:
    """Returns the raw pollutant data.
    Download data here - https://raw.githubusercontent.com/dagworks-inc/hamilton/main/examples/numpy/air-quality-analysis/air-quality-data.csv
    """
    return np.loadtxt(input_file_name, dtype=float, delimiter=",", skiprows=1, usecols=range(1, 8))


def pollutants_A(pollutant_data: np.ndarray) -> np.ndarray:
    """Pollutant A"""
    return pollutant_data[:, 0:5]


def pollutants_B(pollutant_data: np.ndarray) -> np.ndarray:
    """Pollutant B"""
    return pollutant_data[:, 5:]


def AQI() -> np.ndarray:
    """AQI ranges.
    See https://github.com/numpy/numpy-tutorials/blob/main/content/tutorial-air-quality-analysis.md#calculating-the-air-quality-index
    """
    return np.array([0, 51, 101, 201, 301, 401, 501])


def breakpoints() -> dict:
    """AQI breakpoints for pollutants.
    See https://github.com/numpy/numpy-tutorials/blob/main/content/tutorial-air-quality-analysis.md#calculating-the-air-quality-index
    """
    return {
        "PM2.5": np.array([0, 31, 61, 91, 121, 251]),
        "PM10": np.array([0, 51, 101, 251, 351, 431]),
        "NO2": np.array([0, 41, 81, 181, 281, 401]),
        "NH3": np.array([0, 201, 401, 801, 1201, 1801]),
        "SO2": np.array([0, 41, 81, 381, 801, 1601]),
        "CO": np.array([0, 1.1, 2.1, 10.1, 17.1, 35]),
        "O3": np.array([0, 51, 101, 169, 209, 749]),
    }


def pollutants_A_24hr_avg(pollutants_A: np.ndarray) -> np.ndarray:
    """24 hour move average of pollutant A."""
    return _moving_mean(pollutants_A, 24)


def pollutants_B_8hr_avg(pollutants_B: np.ndarray, pollutants_A_24hr_avg: np.ndarray) -> np.ndarray:
    """8 hour move average of pollutant B.
    To make sure both the sets are of the same length, we will truncate the pollutants_B_8hr_avg according to
    the length of pollutants_A_24hr_avg. This will also ensure we have concentrations for all the pollutants
    over the same period of time.
    """
    return _moving_mean(pollutants_B, 8)[-(pollutants_A_24hr_avg.shape[0]) :]


def pollutants(pollutants_A_24hr_avg: np.ndarray, pollutants_B_8hr_avg: np.ndarray) -> np.ndarray:
    """Concatenates Pollutants A and Pollutants B.

    Now, we can join both sets with np.concatenate to form a single data set of all the averaged concentrations.
    Note that we have to join our arrays column-wise so we pass the axis=1 parameter.
    """
    return np.concatenate((pollutants_A_24hr_avg, pollutants_B_8hr_avg), axis=1)


def sub_indices(pollutants: np.ndarray, breakpoints: dict, AQI: np.ndarray) -> np.ndarray:
    """Return sub indicies.

    The subindices for each pollutant are calculated according to the linear relationship between the AQI and standard
    breakpoint ranges with the formula as above:

        $$ Ip = \dfrac{\text{IHi – ILo}}{\text{BPHi – BPLo}}\cdot{\text{Cp – BPLo}} + \text{ILo} $$

    By calling our vectorized function vcompute_indices for each pollutant, we get the sub-indices.
    To get back an array with the original shape, we use np.stack.
    """
    vcompute_indices = np.vectorize(partial(_compute_indices, breakpoints, AQI))
    return np.stack(
        (
            vcompute_indices("PM2.5", pollutants[..., 0]),
            vcompute_indices("PM10", pollutants[..., 1]),
            vcompute_indices("NO2", pollutants[..., 2]),
            vcompute_indices("NH3", pollutants[..., 3]),
            vcompute_indices("SO2", pollutants[..., 4]),
            vcompute_indices("CO", pollutants[..., 5]),
            vcompute_indices("O3", pollutants[..., 6]),
        ),
        axis=1,
    )


def aqi_array(sub_indices: np.ndarray) -> np.ndarray:
    """Using np.max, we find out the maximum sub-index for each period, which is our Air Quality Index!"""
    return np.max(sub_indices, axis=1)


def datetime_index(pollutants_A_24hr_avg: np.ndarray, input_file_name: str) -> np.ndarray:
    """We will now import the datetime column from our original dataset into a datetime64 dtype array.
    We will use this array to index the AQI array and obtain subsets of the dataset."""
    return np.loadtxt(input_file_name, dtype="M8[h]", delimiter=",", skiprows=1, usecols=(0,))[
        -(pollutants_A_24hr_avg.shape[0]) :
    ]


def after_lock(
    aqi_array: np.ndarray, datetime_index: np.ndarray, after_lock_date: str
) -> np.ndarray:
    """Grab period after lock down."""
    return aqi_array[np.where(datetime_index >= np.datetime64(after_lock_date))]


def before_lock(
    aqi_array: np.ndarray, datetime_index: np.ndarray, after_lock: np.ndarray, before_lock_date: str
) -> np.ndarray:
    """Grab period before lock down."""
    return aqi_array[np.where(datetime_index <= np.datetime64(before_lock_date))][
        -(after_lock.shape[0]) :
    ]


def rng() -> typing.Any:
    """Returns random generator (not sure what type it is)."""
    return default_rng()


def before_sample(rng: typing.Any, before_lock: np.ndarray) -> np.ndarray:
    """Returns sample before lock down."""
    return rng.choice(before_lock, size=30, replace=False)


def after_sample(rng: typing.Any, after_lock: np.ndarray) -> np.ndarray:
    """Returns sample after lock down."""
    return rng.choice(after_lock, size=30, replace=False)


def _t_test(x, y):
    """Classic t-test"""
    diff = y - x
    var = np.var(diff, ddof=1)
    num = np.mean(diff)
    denom = np.sqrt(var / len(x))
    return np.divide(num, denom)


def t_value(before_sample: np.ndarray, after_sample: np.ndarray) -> np.ndarray:
    """T-value computed from t-test between before and after sample."""
    return _t_test(before_sample, after_sample)


def dof(before_sample: np.ndarray) -> int:
    """Degrees of freedom based on before sample."""
    return len(before_sample) - 1


def p_value(t_value: np.ndarray, dof: int) -> float:
    """P-value computed from t-value and degrees of freedom."""
    return stats.distributions.t.cdf(t_value, dof)


if __name__ == "__main__":
    import __main__ as analysis_flow
    from hamilton import base, driver

    # let's create a dictionary result -- since we want to get a few things from execution for inspection
    adapter = base.DefaultAdapter()
    # adapter = base.SimplePythonGraphAdapter(base.NumpyMatrixResult())  # could also get a numpy matrix back.
    dr = driver.Driver(
        {
            "input_file_name": "air-quality-data.csv",
            "after_lock_date": "2020-03-24T00",
            "before_lock_date": "2020-03-21T00",
        },
        analysis_flow,
        adapter=adapter,
    )

    # output = ["t_value", "p_value", "before_sample", "after_sample"]
    dr.display_all_functions("./dag", render_kwargs={"format": "png"}, orient="TB")
Requirements
numpy
scipy
sf-hamilton